From Visual Studio 2013, Concurrency Visualizer became a plugin rather than a standard feature. It is still a tremendously useful performance analysis tool, however, particularly when you use the SDK to instrument your code with flags, messages, alerts, and spans.
Concurrency Visualizer provides several views: utilization, threads, and cores. For me, the threads view is most useful. MSDN describes the threads view here, but that page does not do justice to the power of what you can see and find (however, they do offer another page within the docs that gives a bigger glimpse as to the power lurking beneath your fingertips).
The following Concurrency Visualizer timeline is a good example:
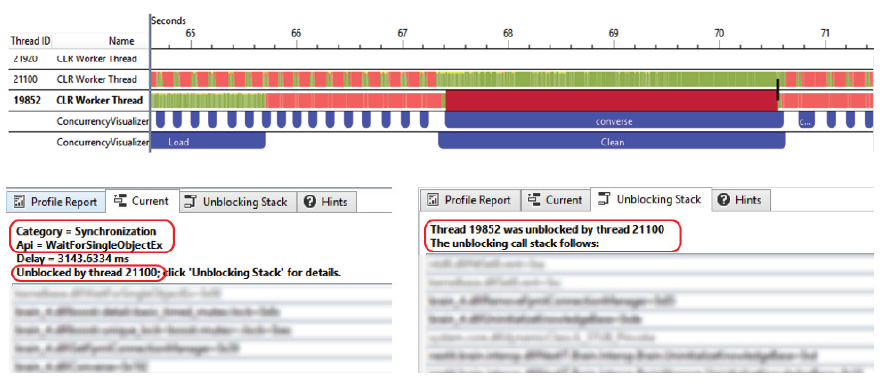
This is from a recent project where a multithreaded system has a large number of users making requests via a web interface and expecting prompt responses back. The system allows an administrator to hot swap pieces of the back end supposedly without interfering with the horde of eager users. But there was a delay of a few seconds now and then, and the source was not clear.
After instrumenting the likely sections of code for Concurrency Visualizer, starting a CV data collection, then running thousands of automated user inputs in parallel with dozens of automated admin inputs, a pattern quickly emerged in the graph.
There was a synchronization lock being held in the admin chunk of code (the "Clean" span) that blocked the end-user processing (the "converse" span) significantly. You can see in the illustration that most of the end-user time was waiting for that lock (the red bar).
I had only to visually scan the timeline to find my markers. Concurrency Visualizer revealed what was being blocked; when the lock was released on one thread and – via the vertical black line at the end of the red block – how that tied back to the other thread and allowed it to continue; and provided stack threads that told me exactly where in the code all this was happening.
For more details, kindly visit https://msdn.microsoft.com/en-us/library/dd627193%28v=vs.120%29.aspx
No comments :
Post a Comment