When you're hunting for a memory leak, it's easy to fall into the trap of not profiling for long enough. Consider this curve:

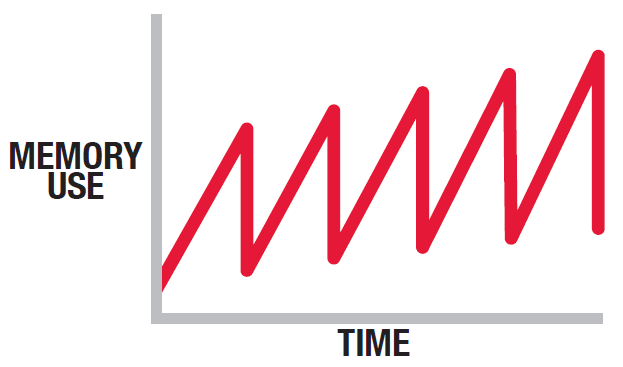
On the face of it, it looks like we might have a memory problem. But of course, garbage collection only happens periodically, so it’s perfectly legitimate for browser memory usage to increase over time. What matters is the pattern you see when garbage collections occur. You expect a sawtooth pattern, a bit like this:

If the sawtooth stays flat, as in the example above, you probably don’t have a leak. On the other hand, if it's increasing, as in the example below, you probably do:
The important point is to make sure you profile long enough to see the whole curve. Otherwise, you might mistakenly believe you have a memory leak, and misidentify the cause as objects that will be garbage collected.
No comments :
Post a Comment